HOW TO GRAPH
Principles | Components | Graph Selection
HISTOGRAMS EXPLAINED
Histograms are a type of bar graph, but with a few important differences. First, whereas bar graphs typically display a variable on the x-axis that is considered qualitative or categorical (e.g., red, green, blue OR Swiss, Italians, Americans, Germans), histograms typically display a variable on the x-axis that is considered quantitative or numerical (e.g., 10, 20, 30, 40, etc. or numerical ranges such as 0-5, 6-10, 11-15, 16-20, etc.). Second, whereas bar graphs often separate the individual bars on the graph with consistent (white/empty) spacing in between them, histograms typically do not separate the individual bars on the graph with consistent spacing. Third, in a histogram the y-axis almost always corresponds to the frequency of occurrence a particular event or category.
EXAMPLES
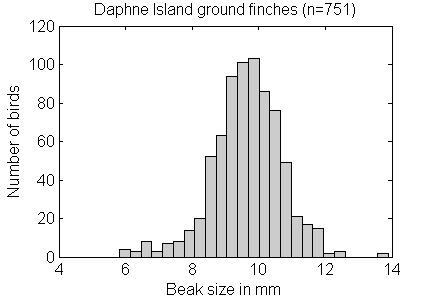
Here are two examples of well-constructed histograms:
Example 1

Example 2

TUTORIALS
YOUTUBE’S cylurian
[youtube https://www.youtube.com/watch?v=sC7gjg9g3JU&w=560&h=315]
YOUTUBE’S MySecretMathTutor
[youtube https://www.youtube.com/watch?v=KCH_ZDygrm4&w=560&h=315]
GRADING RUBRIC
Click HERE to see the grading rubric Dr. Merritt uses to assess the histograms you create in his science classes.